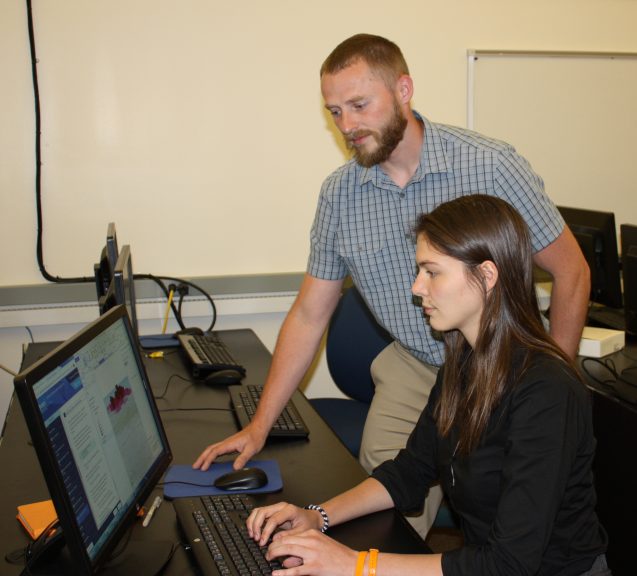
When Dorothee Grant was first applying to colleges a few years ago, machine learning wasn’t even part of her vocabulary. At her small, rural high school in upstate New York, academic opportunities were limited. But Grant’s first internship this past summer, working at CIESIN with geographic information systems (GIS) programmer Kytt MacManus, accelerated her understanding of the use of machine learning to work with remotely sensed data.

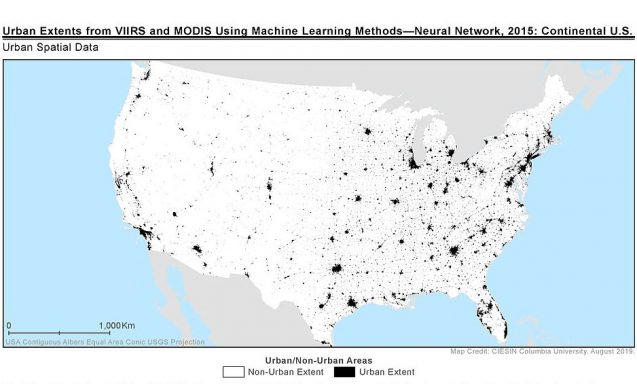
Currently a computer science major at Columbia University’s School of General Studies, Grant helped curate a new dataset that will help to map urban areas at large spatial scales. The dataset was developed by applying the latest machine learning techniques to daytime and nighttime lights satellite data from NASA and NOAA. The data set is being produced under CIESIN’s main program, the NASA Socioeconomic Data and Applications Center (SEDAC).
Grant also worked on an ongoing project exploring the feasibility of using daily data from a nighttime satellite to estimate population mobility in near real time—a first. The project was funded by the Group on Earth Observations (GEO), and relies on data from the VIIRS instrument, also known as NASA’s Black Marble. The myriad images of the bright lights of planet Earth, captured by sensors on satellites orbiting in space hundreds of miles above us, can produce information that supports sustainable development by enabling more frequent monitoring of progress toward the goals set by the United Nations. Improved nighttime lights data can also be used as a proxy for economic activity and urban growth, helping us understand how a city has changed over time. And lights data can assist in disasters both before and after—for example, as part of post-disaster recovery following Hurricane Maria, when nighttime lights were used to track efforts to restore the electric grid.
Intern Dorothee Grant’s path to the arena of remote sensing was roundabout, although seeds of interest in science were planted early. Grant was always an enthusiastic student, who was picking out her dorm furniture by the time she was in the eighth grade, she says. The youngest in a family with two high-achieving older sisters, she followed their lead by focusing on math, and assumed she would study biology as did one sister, an eventual MD. Instead, a fork in the road beckoned: In the middle of writing her Common App essay, a call came to model for an agency in New York City. Grant said yes.
After two years of fashion shoots around the world, Grant felt ready to embark on academic life. Living in London now, her roommate was a computer science major. Intrigued, she took some online computer science classes and realized that this new direction, independent of the life paths of her big sisters, suited her. She credits this “gap year plus” experience with her being accepted into Columbia. “I wouldn’t have gotten in had I applied as a senior,“ she says, noting that her small high school could not have prepared her sufficiently.
Grant’s work at CIESIN is part of a larger, ongoing aim to improve the spatial accuracy in determining how the world’s population is distributed. An earlier data collection developed under SEDAC, the Global Rural-Urban Mapping Project (GRUMP), refined census-based population estimates using nighttime lights data from NOAA’s DMSP-OLS satellite, but the images were too “noisy”—presenting too many issues to be leveraged as daily data—thus limiting how GRUMP could be applied. SEDAC’s new project with GEO addresses many of these issues by using a daily frequency of nighttime lights data from Black Marble.
The analysis Grant undertook was exploratory, evaluating the literature and working with the data towards the goal of developing an algorithm for identifying the location of populations. First, she analyzed satellite imagery that was already processed to a certain degree by the team at NASA Goddard Space Flight Center (GSFC), and was massive—“Something like 300 million data points for the whole world,” she says, “as opposed to when I was working with Mexico, when there were just five tiles—fewer than nine million data points.“ The data had been packaged into tiles, which are smaller units that are more practical to exchange over the internet. One of her tasks was to “stitch” these tiles back together into a mosaic, to provide a continuous image to analyze.
Grant began her analysis with Las Vegas, because it is a small city, with fewer data points than Mexico. “The overall purpose was to get an idea of the relationship between population density and luminosity,” she explains, “so that if we can predict lights, we can predict population. And by better measuring past luminosity, we might be able to predict future luminosity, and unlock a key to a better understanding of how population is distributed, and how it moves around.”
She found that running a PMF (persistent model forecasting, a type of time series data algorithm) showed the best results. “It will take five days at a time, then try to guess the sixth day, then see how close it was—in essence, ‘learn’ from its mistake. Then it applies the lesson it learned to the next five days, and so on. It does that a multitude of times until the algorithm makes a more accurate prediction.” Thus the machine learns.
Grant also looked at identifying trends in luminosity over time. Supervisor MacManus suggested trying to identify the difference between weekend and weekday lights and looking for striking and consistent differences in light values, like the sudden explosion of lights that occurs around the Christmas holiday, for example, or the incongruous emergence of illumination in the midst of the desert at the annual “Burning Man” event. “I started everything in Las Vegas first,” she explains. “Then I separated all the weekends and weekdays, a year at a time, and compared them to see if there was a statistical difference or not.” Disappointingly, she found no difference. Back to the drawing board, she ran the same test in Mexico and saw the distinctions she was looking for.

Use of the Black Marble data is groundbreaking not only because of the increase in frequency with which usable data is collected, but because of new processing techniques that NASA GSFC uses to reduce false readings and over-estimations in the data stream. Thanks to these breakthroughs, there is optimism in the data community that daily, weekly, or monthly nighttime lights information could be used for near real time monitoring of population, with new possibilities for analysis and critical application. This work, and Grant’s contribution, represents a first check of that potential.
Grant, too, is optimistic, but also for the new avenues the internship opened up. Now starting her sophomore year, she will continue her research at CIESIN as part of a directed study, for credit. She is sold on the peculiar character of math. “It’s either right or wrong,” she says, “but there’s so many ways to get there.” She found she especially enjoys coding—“It’s like a puzzle”—but likes even more the idea of working for the “greater good.” She explained, “Everyone here at CIESIN has the idea of trying to help better the world, and I think that’s admirable.” She also learned she would prefer a work setting where she can get out from behind the monitor once in a while, and discovered an appreciation for NASA and NOAA, noting, “I think my experience is going to push me towards those agencies.”
As Grant’s experience at CIESIN working with GIS and machine learning addressed some essential life questions, it also raised new ones. Her enthusiasm for embracing complex challenges, combined with her sense of adventure, will surely help her continue to find fruitful answers.
Dorothee Grant’s summer internship under CIESIN’s main program, the NASA Socioeconomic Data and Applications Center (SEDAC), was partially funded by the Earth Institute’s internship program. She recently received an Earth Institute Travel Grant to fund a presentation of her directed study at the 2019 AGU. Kytt MacManus is senior systems analyst/GIS developer at CIESIN, and principal investigator of the project, Assessing NASA’s SUOMI-Nighttime Product Suite to Improve Measurement Monitoring and Achievement of Urban SDGs and Associated Targets and Indicators. The VIIRS-NPP instrument is part of the Suomi National Polar-orbiting Partnership (NPP) satellite, jointly operated by NASA and the National Oceanic and Atmosphere Administration (NOAA).


