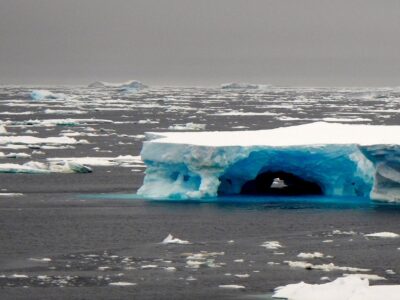
Ice shelves can behave like dominos. When they are lined up and the first one collapses it can cause a rippling effect like dominos. We have seen this with the Larsen ice shelves. Named in series, the Larsen A, B and C shelves extended along the northeastern edge of the West Antarctic Peninsula, and covered a large swath of coastline as recently as 20 years ago. Bordering the western edge of the Weddell Sea, each extended from a separate embayment yet merged into a large expanse of ice, considered one ice shelf complex. All this was before 1995, before the dominoes began to collapse.

It was January 1995, toward the end of the austral summer, when Larsen A, the smallest of the three shelves, broke apart rather suddenly and was gone. The furthest north of the Larsen trio, this small shelf was situated just north of the Larsen B and just outside of the Antarctic Circle. Due to its size and location, the 1,500-square-kilometer block of ice was the most vulnerable of the three Larsen shelves. Warming water that had been moving around the peninsula was the probable cause for the demise.

When Larsen A disappeared, Larsen B immediately became more vulnerable. Although twice the size at 3,250 square kilometers, the shelf was now un-buffered from warming ocean waters to the north; this combined with several warm summers and Larsen B weakened and became destabilized. In 1998, satellites captured evidence of the front edge of Larsen B beginning to change. Satellite images pointed out melt water ponds on the surface of the shelf, but with some 220 meters of ice thickness, these ponds did not seem to pose a threat. Then between early February and early March 2002, the shelf suffered a massive collapse, with section after section all but evaporating before our eyes. There was disbelief among the science community that a section of shelf this size, and one that had been relatively stable for an estimated 10,000-12,000 years, could so swiftly suffer a collapse. The second domino had fallen.

With the loss of a significant section of the Larsen shelf complex, there was a subsequent acceleration of the glaciers that had once been braced by the shelves’ protective presence. Without the stable pressure pushing back against these glaciers, the ice sheet in this area accelerated by up to 300 percent, transferring ice from the Antarctic continent into the ocean and contributing more ice to sea level rise. With the acceleration came a rapid loss in size in the glaciers feeding the Larsen area.

Larsen C remains the fourth largest of the ice shelves by a few hundred square kilometers of ice. A crack appeared in the shelf in 2011 and has grown in size over the subsequent years. Set back about 20 kms. from the edge of the shelf, it threatens to break off about 8 percent of the shelf, or a chunk of ice about the same size as the state of Delaware, at ~6,000 sq. km. With the crack set so far back, there is concern that it might threaten the integrity of the larger ice sheet, weakening the support that holds the shelf in place.

Just as Larsen B revealed the speed with which an ice shelf can collapse, Larsen C may be poised to reveal how quickly a large crack can propagate along the shelf. The rift is growing even during the Antarctic winter, adding an additional 22 kms. to a length of 130 kms. in total during the last austral winter between March and August 2016. In addition, the crack has widened from 200 meters to 350 meters. Overflying the crack, we were able to collect high resolution imagery that will help with tracking the fate of the third domino in the lineup.

IceBridge: Since 2009, the NASA IceBridge project has brought together science teams to monitor and measure each of the ice features in order to improve our understanding of changes in the climate system and our models. Lamont-Doherty, under lead scientists Jim Cochran and Kirsty Tinto, has led up the gravity and magnetics measurements for these campaigns. You can read about earlier IceBridge expeditions to Antarctica and Greenland on State of the Planet, here and here.
Two other project links: http://www.ldeo.columbia.edu/icebridge
http://www.ldeo.columbia.edu/res/pi/rosetta


