Over the past decade, average global food prices have more than doubled, with 2008 and 2010 seeing excruciating price spikes that each had far-reaching economic, geopolitical and social consequences.
What explains this long-term trend – and why did prices spike so much higher in the years that they did?
For policymakers at all levels, answering that question is of vital importance if there is to be any hope of feeding the world’s growing population in the coming decades, much less maintaining social order. According to recent research by the New England Complex Systems Institute, spikes in food prices are so closely correlated with social unrest that they were able to identify a particular food-price threshold above which food riots are very likely.

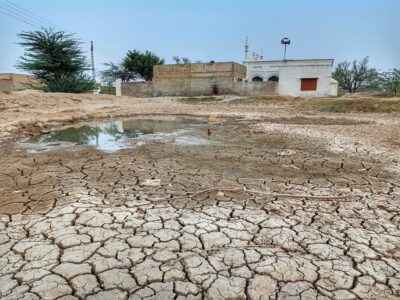
The most obvious cause for high food prices is oil – in fact, charts showing the correspondence between food and oil prices show an eerie overlap, especially in the last half decade. Water scarcity and climate are major players as well, however. According to the just released United Nations World Water Development Report, demand for water will grow by 55 percent in the next 40 years, and farmers will need 19 percent more water by 2050 just to keep up with growing food demands.
Given that groundwater is depleting rapidly around the world—including in many of the most important food producing regions—it’s hard to see how water scarcity will not be as a crucial factor as oil in driving food prices over the coming years. Breadbasket regions in India and China are in serious danger, as are the now all-but-water-depleted countries of the Middle East: in particular Yemen, Syria, Libya, Iraq and Egypt. Saudi Arabia has now so thoroughly depleted its aquifers that it will most likely phase out domestic production of wheat this year.
Finally, there’s climate. Earth Institute post-doctoral research scientists Indrani Pal and Tara Troy have been studying the relationship between climate extremes and crop yields.
“Climate definitely affects our crop yields,” says Troy. “A couple of years ago, we got decimated – drought/flood/drought/flood, in almost all the major wheat producing regions.” For example, 2011 drought in China, 2010 drought in Russia, 2011 flood in Australia.
The threat to yield prompted many governments to adopt policies that rapidly drove up prices. In Russia, for example, the crushing summer heatwave and wildfires of 2010 prompted the government to ban grain exports. The resulting price spike is considered by many analysts to be a proximate cause of the 2011 Arab Spring riots.

“If you can set up that relationship between climate extremes and crop yields, and then we can predict those extremes,” says Troy, “then we actually have predictive capability on food prices. Because food prices are dependent on how many stocks there are and current production.”
Right now, Troy and Pal are looking at various measures of extremes—from how much rainfall happened in a season, to incidence of floods, droughts, heat waves and dry spells. By covering the historical period from 1960 to the present, they hope to control for various other geopolitical or energy issues that might contribute to price variations at a given time.
One of the challenges of such an analysis, Troy says, has to do with the problem of scale. “The problem with yield is that we get one data point for one year for one country in many places. That’s a huge aggregate of everything that happens in that country, so that might not be enough information to tease out the direct relationship between these extremes and yield. But the agricultural literature is all about the small scale.”
But even if it’s not possible to scale results up for an entire country, she says, “we can look at it at a finer scale where people are growing food,” and analyze if extremes are changing, both in the past, and in the context of coming global climate changes as predicted in the IPCC’s new climate models.
Coupled with this analysis, Troy is developing another, physically-based model that will help determine when a particular region is entering water stress. “You give it precipitation and temperature . . . and then its solves how much water is left in the river, how much in the soil, how much evaporates.” She has incorporated a crop-growth model as well to help calculate irrigation and how irrigation varies based on climate.
“I wanted to get a model in which I can identify when a region is under water stress, so that we can do projections. If we can identify hot spots, maybe we can figure out how we can solve these problems.”


[…] The Earth Institute at Columbia University explains the link between water stress and food prices. […]