Why does sea level change at different rates? How has it changed in the past? Who will be at risk from more extreme weather and sea level rise in the future? Our scientists often hear questions like these from students, government officials and the media.
 To help share the answers more widely, scientists at Lamont-Doherty Earth Observatory created a new app that lets users explore a series of maps of the planet, from the deepest trenches in the oceans to the ice at the poles. You can see how ice, the oceans, precipitation and temperatures have changed over time and listen as scientists explain what you’re seeing and why.
“We wanted to make climate data accessible and engaging to the public, for everyone from students to interested adults. The data is displayed in interactive maps with just enough guidance to support independent exploration,” said Margie Turrin, education coordinator at Lamont, who designed the free app called “Polar Explorer: Sea Level” with Bill Ryan, Robin Bell, Dave Porter and Andrew Goodwillie. She presented the just-released app recently at the American Geophysical Union meeting in San Francisco.
Turrin leads science education programs with schools across the New York and hands-on public projects, including monitoring the health of the Hudson River Estuary. She and Ryan created the app with broad-based education in mind and have found a welcome reception from middle and high school teachers, undergraduate science instructors, and the inquisitive public. The app pulls global information from databases created by internationally respected scientific organizations, including the National Oceanic and Atmospheric Administration, the National Aeronautics and Space Administration, the U.S. Geological Survey and the Center for Earth Science Information Network (CIESEN) at Lamont.

The app starts with the basics: How and why we study the remnants of old shore lines, what the sea floor looks like, and why the ocean is not actually flat.
It then looks more closely at how the oceans differ from region to region and how they have changed over time in temperature, salinity and sea level. It explores the role of the atmosphere and changes in temperature, radiation and rainfall over time. Flip quickly through the rainfall map month to month over the past three years, and you’ll clearly see the rain band across the tropics and time-lapse of how areas of rain change over time.
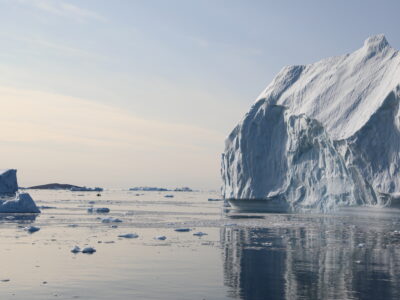
In exploring the contribution of glaciers and ice sheets to sea level rise, you can find the largest glaciers in the world and see how the Greenland and Antarctic ice sheets changed over a decade. If the Greenland Ice Sheet, which sits on land, were to completely melt, it would raise sea level by 6 to 7 meters. The app explains why and then looks at the impact.
Data from CIESIN and other organizations takes these scientific explanations the next step: It explores the impact of sea level rise, flooding and extreme weather on communities around the world. The app answers questions about who is vulnerable by looking at population density, low-lying coastlines and islands, and historic hurricane and cyclone tracks, and storm surges over the past 135 years. The data also maps areas of the U.S., China, and other parts of Asia that will be most vulnerable to economic losses as extreme weather increases and sea levels rise.
 Sea level change is a topic that brings together complex science with both societal and economic impacts. Tying together the range of physical science interactions and matching them to the implications for human populations is important, and yet not always easy to do. The app was designed to pull together the data and put it straight into people’s hands to explore and interact with.
While the dynamic data is primarily from recent decades, the app also draws in historical data to help tell the story of climate change through past centuries. It lets you compare three periods: 1700, before the Industrial Revolution; 5,000 years ago, during the mid-Holocene; and an interglacial period 125,000 years ago when temperatures were warmer than today. You can see air temperatures, sea surface temperatures, salinity, precipitation, evaporation, ice thickness and ice concentration at each point in time. You can also explore how large ice sheets in North America and Europe receded over the time span from 20,000 years ago to 5,000 years ago.
“Polar Explorer: Sea Level” works well in formal and informal education settings, but it holds lessons for everyone interested in understanding more about our planet, the climate and how and why sea level is rising, Turrin said.
The app is currently available for the ipad, and an iphone version is due out in a few days. A browser version is also available for classrooms and seminars. You can download the app at http://www.polarexplorer.org.


